Using Excel for Project management is at the core of every person’s work life, where it indicates how one plans, organizes, and executes daily activities efficiently and clearly. Advanced Excel is a common skill in most professions, and it represents an essential tool for developing this competency. Even in an era where Artificial Intelligence is rapidly transforming workplaces, a strong understanding of Excel functions remains highly valuable and widely expected.
For students juggling with a pile of assignments, a group project, and internship applications often with overlapping deadlines, this scenario will feel all too familiar. If you’re constantly jumping between messages, emails, and sticky notes to keep everything in check, well, you’re not alone: this overwhelming rhythm is faced at one point or another by many students.
With Microsoft Excel you can keep yourself organized with tasks, due dates, workload balancing, and the general structure of academic life-skills that will carry over into your career.
Let’s understand how you can use Excel for project management with the help of different functions of the tool.
What Is Project Management?
In simple terms project management simply involves answering five straightforward questions:
- What needs to be done?
- Who’s doing it?
- When does it start?
- When does it end?
- Is it actually done?
That’s it. Nothing mysterious, nothing complex. Excel helps you answer these kinds of questions in one organized place, instead of across dozens of threads of chat and half-forgotten notes.
Why Should Students Learn Using Excel for Project Management?
Beyond the obvious benefit of getting your life organized, mastering Excel gives you a legitimate competitive edge. It’s one of those rare skills that matter across almost every industry in the world.
But here’s what makes Excel particularly valuable for learning:
- It teaches you to think systematically: When you build a project tracker, you’re not just filling in cells-you’re structuring information logically, anticipating what you’ll need to know, and building systems that work even when you’re not actively managing them.
- It introduces automation naturally: Once you understand how formulas work, you think differently. Instead of updating numbers by hand, you build spreadsheets that update themselves. And that shift in thinking-from doing work to building systems that do work-is exactly what employers want.
- It bridges the gap between theory and practice: You might read about project management all day, but building your first Gantt chart in Excel? That’s when concepts actually click.
Setting the Foundation of Your Project
Every good, solid project starts with a clear task list. In Excel, this becomes your master table-the foundation everything else builds on.
- Your basic structure should include:
- Task name
- Start date
- End date
- Duration
- Assigned Person
- Status
Here’s where most beginners make their first mistake: they type dates as text, like “Dec 15”. Always use Excel’s proper date format.
Why?
Because Excel treats properly formatted dates as numbers, which means you can calculate with them.
For the duration, don’t key it in yourself. Let Excel compute it. The formula’s pretty simple:
=End Date – Start Date.
This one habit separates casual Excel users from people who actually know what they’re doing.
Understanding Gantt Charts From Scratch
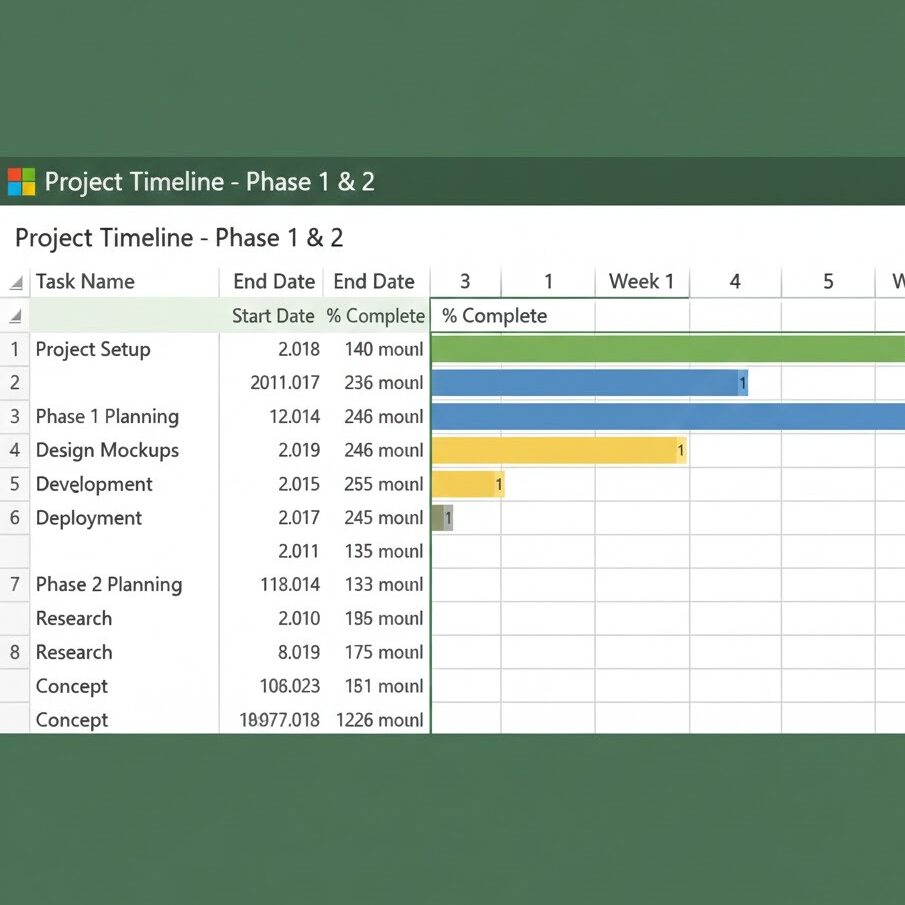
If you have ever seen a Gantt chart, you may think they appear to be complicated. They are not. A Gantt chart is simply a visual timeline showing tasks as horizontal bars.
At a glance, it tells you:
- When each task starts
- How long it runs
- Which tasks occur in parallel
The interesting thing about creating Gantt charts in Excel is that they use a stacked bar chart. What you’re doing behind the scenes is create two bars for each task: one invisible “start date” bar which positions everything correctly, and one visible “duration” bar that displays the actual work period.
Once you understand this logic, Gantt charts stop being intimidating. You’re essentially teaching Excel to read dates as positions on a timeline. And because Excel treats dates as numbers behind the scenes, it knows exactly where to place each bar.
Making Your Gantt Chart Actually Useful
For presentations, static charts can be fine, but if you’re managing a continuing project, you need dynamic charts that refresh automatically when your data does.
The key is linking everything:
- For calculations, use formulas
- Tie your chart directly to your data cells
- Never adjust bar sizes manually
When you move a deadline in your task list, the chart should update immediately. If it doesn’t, you’re working harder than you need to be. That kind of automation is what makes Advanced Excel truly powerful for project management.
The Three Essential Trackers Every Student Needs
While Gantt charts give you the big picture, trackers help with day-to-day execution. Think of them like your dashboard for the project.
1. Task Tracker
This is your most used tool. It answers one critical question: what’s the current status?
Keep it Simple:
- Task name
- Due Date
- Priority: High/Medium/Low
- Status: Not Started/In Progress/Completed/Blocked
Use Excel’s data validation to create dropdown lists for Status. Then apply conditional formatting so that it colors in automatically: green for completed, yellow for in progress, red for blocked. Suddenly you can see your entire project’s health at a glance.
2. Issue Tracker
Things go wrong, group members disappear, requirements change, or resources become unavailable.
An issue tracker keeps these problems visible and ensures they are not forgotten:
- Issue description
- Date identified
- Impact: High/Medium/Low
- Owner, who’s fixing it
- Resolution status
Writing issues down does something powerful ( both in work and personal life) : it forces you to articulate the problem clearly, a process which often reveals the solution in and of itself.
3. Resource Tracker
Work distribution gets messy in group projects, some people feel stressed, overloaded while others move through the same situation easily.
A resource tracker makes working in groups easy and organised:
- Team member name
- Tasks assigned
- Estimated effort (hours)
- Actual effort (hours)
Such visibility also aids you in redistributing work fairly and effortlessly.
The Formulas That Make Everything Smarter
This is where Excel earns its keep. The right formulas add intelligence to your spreadsheet without requiring any manual updates.
- Date calculations: =DAYS(end_date, start_date) gives you duration automatically.
- Status messages: =IF(TODAY()>deadline,”OVERDUE”,”ON TRACK”) tells you which tasks are behind schedule.
- Progress tracking: =COUNTIF(status_column,”Completed”)/COUNTA(status_column) calculates your completion percentage.
- Effort totals: =SUMIF(person_column,”Your Name”,effort_column) shows how much work each person has logged.
Making Information Visible with Conditional Formatting
Our brains process visual information more quickly than text. Conditional formatting exploits this.
Set up rules to automatically:
- Highlight overdue tasks in red
- Completed tasks should be in green
- Flag high priority items in bold
- Color code status categories
The beauty of conditional formatting is that it requires absolutely zero ongoing effort. You set the rules once, and Excel applies them automatically as your data changes.
Choosing the Right Charts for Your Work
Advanced Excel users don’t just make charts, they choose the right charts. Each type tells a different story.
Line Charts
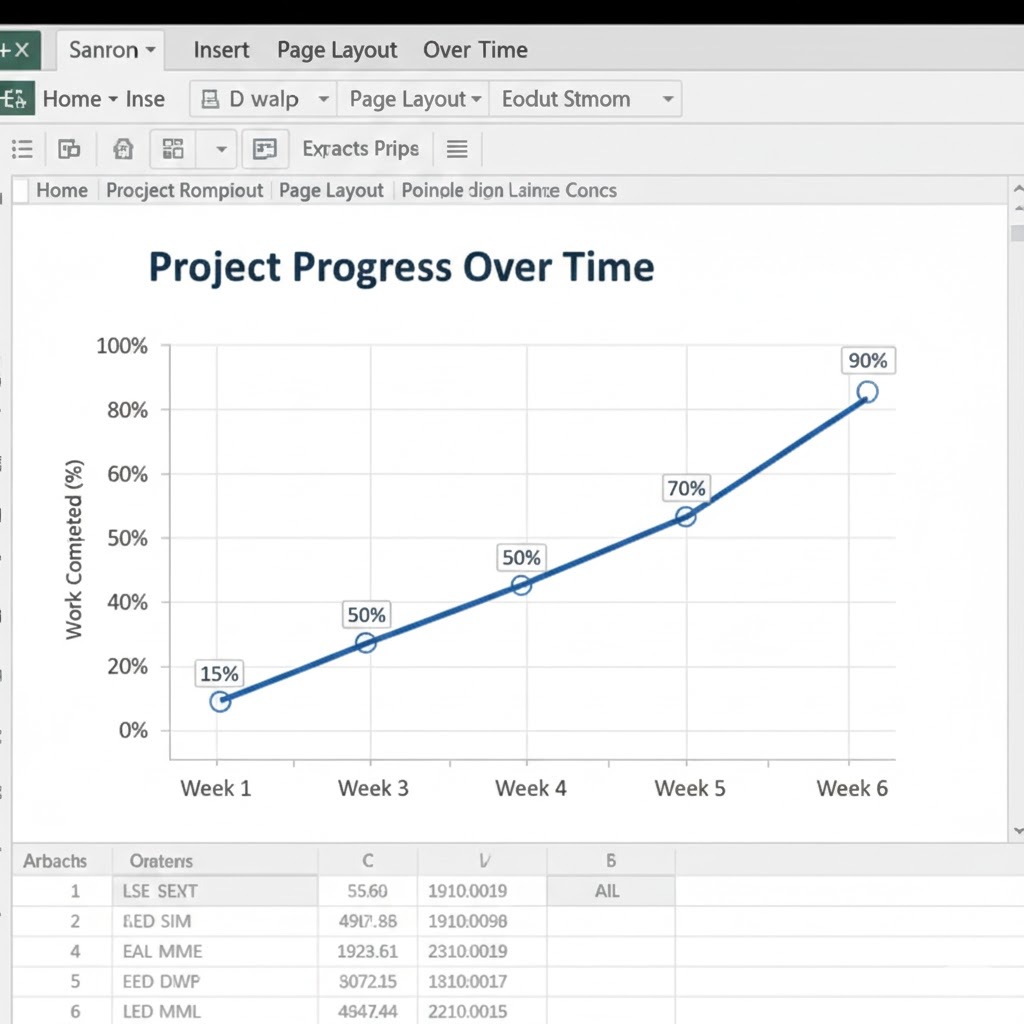
A line chart in Excel is a graphical representation that uses lines to show changes in data values over a period of time. Use line charts when you’re showing progress across dates. They are perfect for:
- Cumulative task completion over weeks
- Daily productivity trends
- Burn-down charts that indicate work remaining
Pie Charts
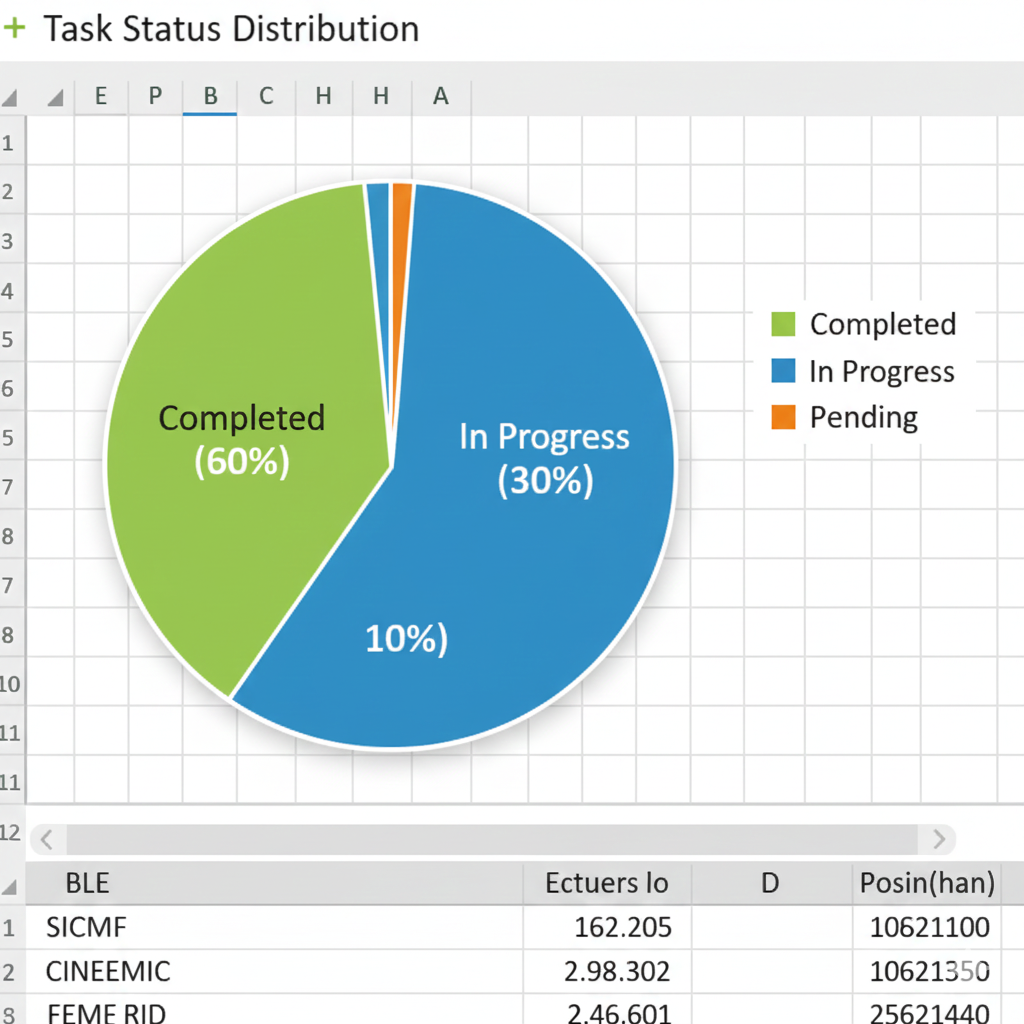
Pie charts answer “how is this divided?” They are useful in:
- Breakdown of tasks into status: 30% complete, 50% in progress, 20% not started
- Distribution of effort by team member
- Time allocation across different phases of the project.
But please note that charts get messy with more than 5-6 slices. If you have eight status categories, question whether you really need that many.
Bar Charts
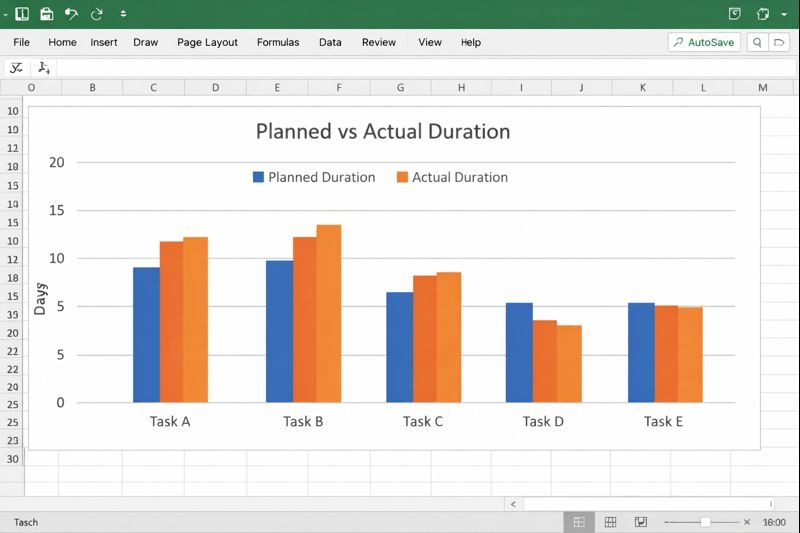
Bars and columns are used when you need to show comparisons of things next to each other:
- Planned duration vs actual duration for each task
- Tasks by each of the team members
- Estimated effort vs. actual effort
These charts make the differences obvious, even to people who haven’t looked at your raw data.
Knowing which chart to use isn’t about memorizing rules-it’s about understanding what question you’re trying to answer.
Building a Project Dashboard
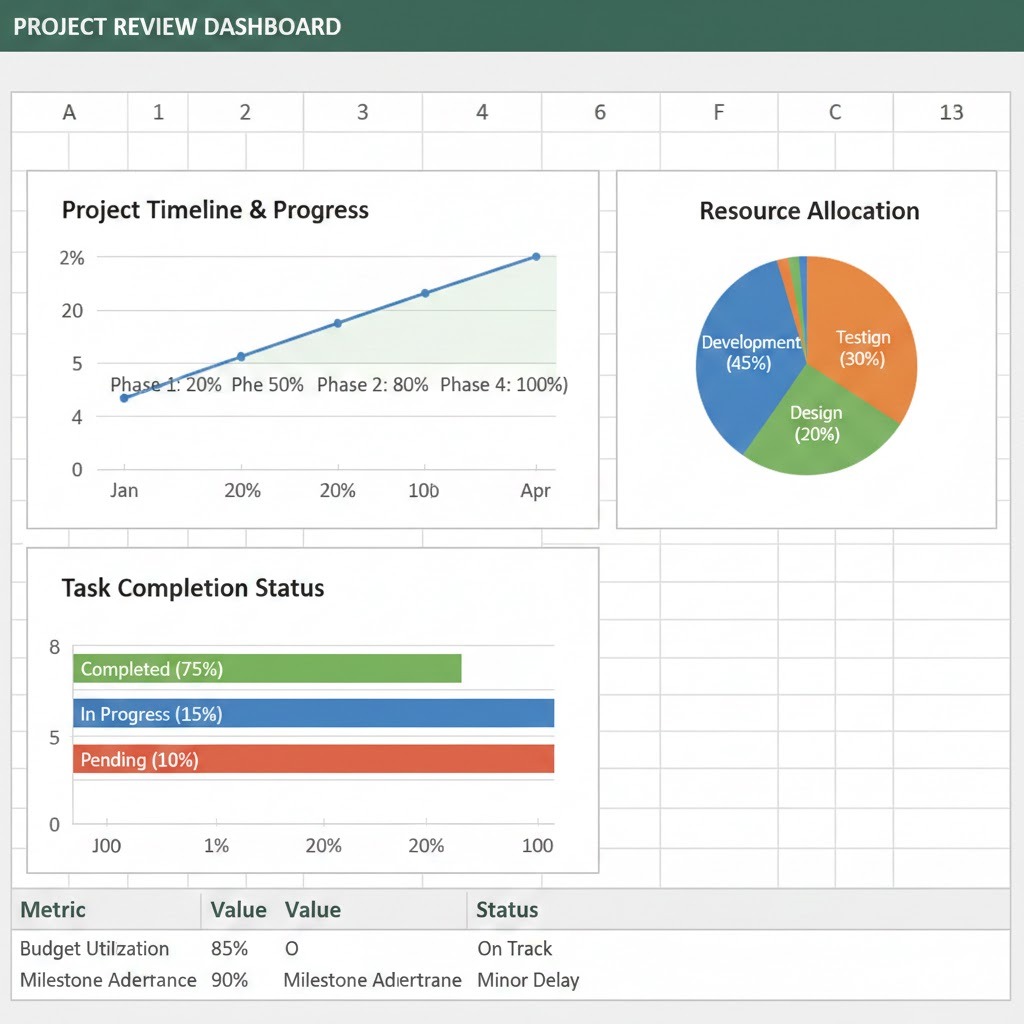
Once you’re comfortable with individual trackers and charts, combine them into a dashboard. Think of it as the homepage for your project.
Basic dashboard components may include:
- Key numbers at the top: total tasks, completed, pending, % complete
- Status pie chart showing the task distribution
- Timeline line chart showing the progress over time
- Resource bar chart showing work load distribution
The goal is to make one screen that answers the question “how’s the project going?” without any person having to dig through your data.
Best Practices for Collaboration
Excel files are easy to share, but shared files can quickly get chaotic. A few simple practices prevent disasters:
- Use clear names for the sheets: “Task Tracker” is clearer than “Sheet1.”
- Add instructions: Create a “README” sheet explaining how the file works.
- Protect Your Formulas : Lock cells that contain formulas so others can’t accidentally break them.
- Backup regularly: Both OneDrive and Google Drive auto-save and keep version history in case.
- Set updating Deadline: “Everyone updates their status every Monday by 6 PM” keeps the spreadsheet from getting stale.
Why Learning Project Management Through Excel Actually Matters for Your Career
Excel project management develops professional thinking. When you build a project tracker, you’re learning to
- Plan systematically instead of reactively
- Think in terms of data and what it reveals
- Communicate visually rather than only verbally
- Automate routine tasks to free up time for decision-making
These are professional skills that are instantly recognizable by internship interviewers and hiring managers. There’s an added bonus of confidence when you walk into a group project meeting with a proper tracker and Gantt chart. You’re not only organized, but through competence, you’re showing leadership.
Ending Note!
Reading about Excel is one thing, but you won’t really know it until you build something. Then, start with a real project you’re already managing-even if it’s just planning your study schedule or coordinating a small event. Build a task list, create a simple tracker, and make your first Gantt chart. It won’t be perfect, but it will be yours.
With each project, try to add one new technique, maybe conditional formatting, then a formula, then a dashboard. This gradual approach will build lasting competence instead of overwhelming you. With structured guidance, courses that focus particularly on project-based Excel learning can make a dramatic difference in your pace.
Look for programs that focus on real-life scenarios rather than abstract formulas, and those that make you actually build projects rather than just watch demonstrations. You don’t need fancy software or special tools to manage projects. Excel can offer all that you need to plan, track, and communicate effectively, and you probably already have it.
For a student, this is particularly valuable if you are building skills serving you immediately-by reducing academic stress-while preparing you for a job where these abilities are simply expected. Master Advance Excel, and you are not just ahead of your peers; you are ready for what comes next.
Microcomputer Centre provides in-depth Practical Advanced Excel courses that take students through basics of Excel to the professional management and analysis of projects. We Teach Excel with real-life scenarios, practical exercises, and clear instruction help provide long-lasting confidence and also refer you for the Jobs in the Market.
A really good blog and me back again.